
Private Equity
Your fund reporting is current. Your portfolio companies aren't.
FactorIQ tracks financial and operational performance at the operating-company level, continuously — so the value-creation plan and what the business is actually doing stop being two different documents.
What breaks today
Three failures that keep the portfolio a quarter behind the business.
Failure 01
The quarterly rebuild.
Analysts reconstruct the same portfolio-company model every quarter because last quarter's version lives in someone's local Excel. The formulas get re-derived, the adjustments get re-argued, and the EBITDA bridge gets re-typed — three months on, three months off.
Failure 02
Twelve formats, one portfolio.
Every operating company reports differently. One CFO sends a PDF board deck, another a QuickBooks export, a third a bespoke Excel with tabs the associate has learned by heart. Normalizing them is a job, and it's the job standing between you and an answer.
Failure 03
No line from plan to performance.
The 100-day plan and the value-creation plan sit in a deck. The operating data sits somewhere else. Nobody reconciles them until the quarterly review — and by then the workstream owner has already changed twice.
The loop, for a PE sponsor
Sourcing, diligence, and portfolio monitoring on one continuous surface.
Stage 01
Discover
Platform and add-on sourcing tuned to your buyout thesis — sector, size, ownership structure, and the white space around the platforms you already own.
Stage 02
Diligence
Quality-of-earnings review, working-capital analysis, EBITDA-bridge construction, and management assessment in one workspace, with the CIM and QoE already read before the deal team meets.
Stage 03
Monitor
Operator Intelligence on every portfolio company: P&L, KPI variance against underwriting, covenant headroom, and value-creation-plan status, refreshed as the portco's ledger produces the numbers.
Operator Intelligence
The portfolio-company view a deal partner can open on a Tuesday.
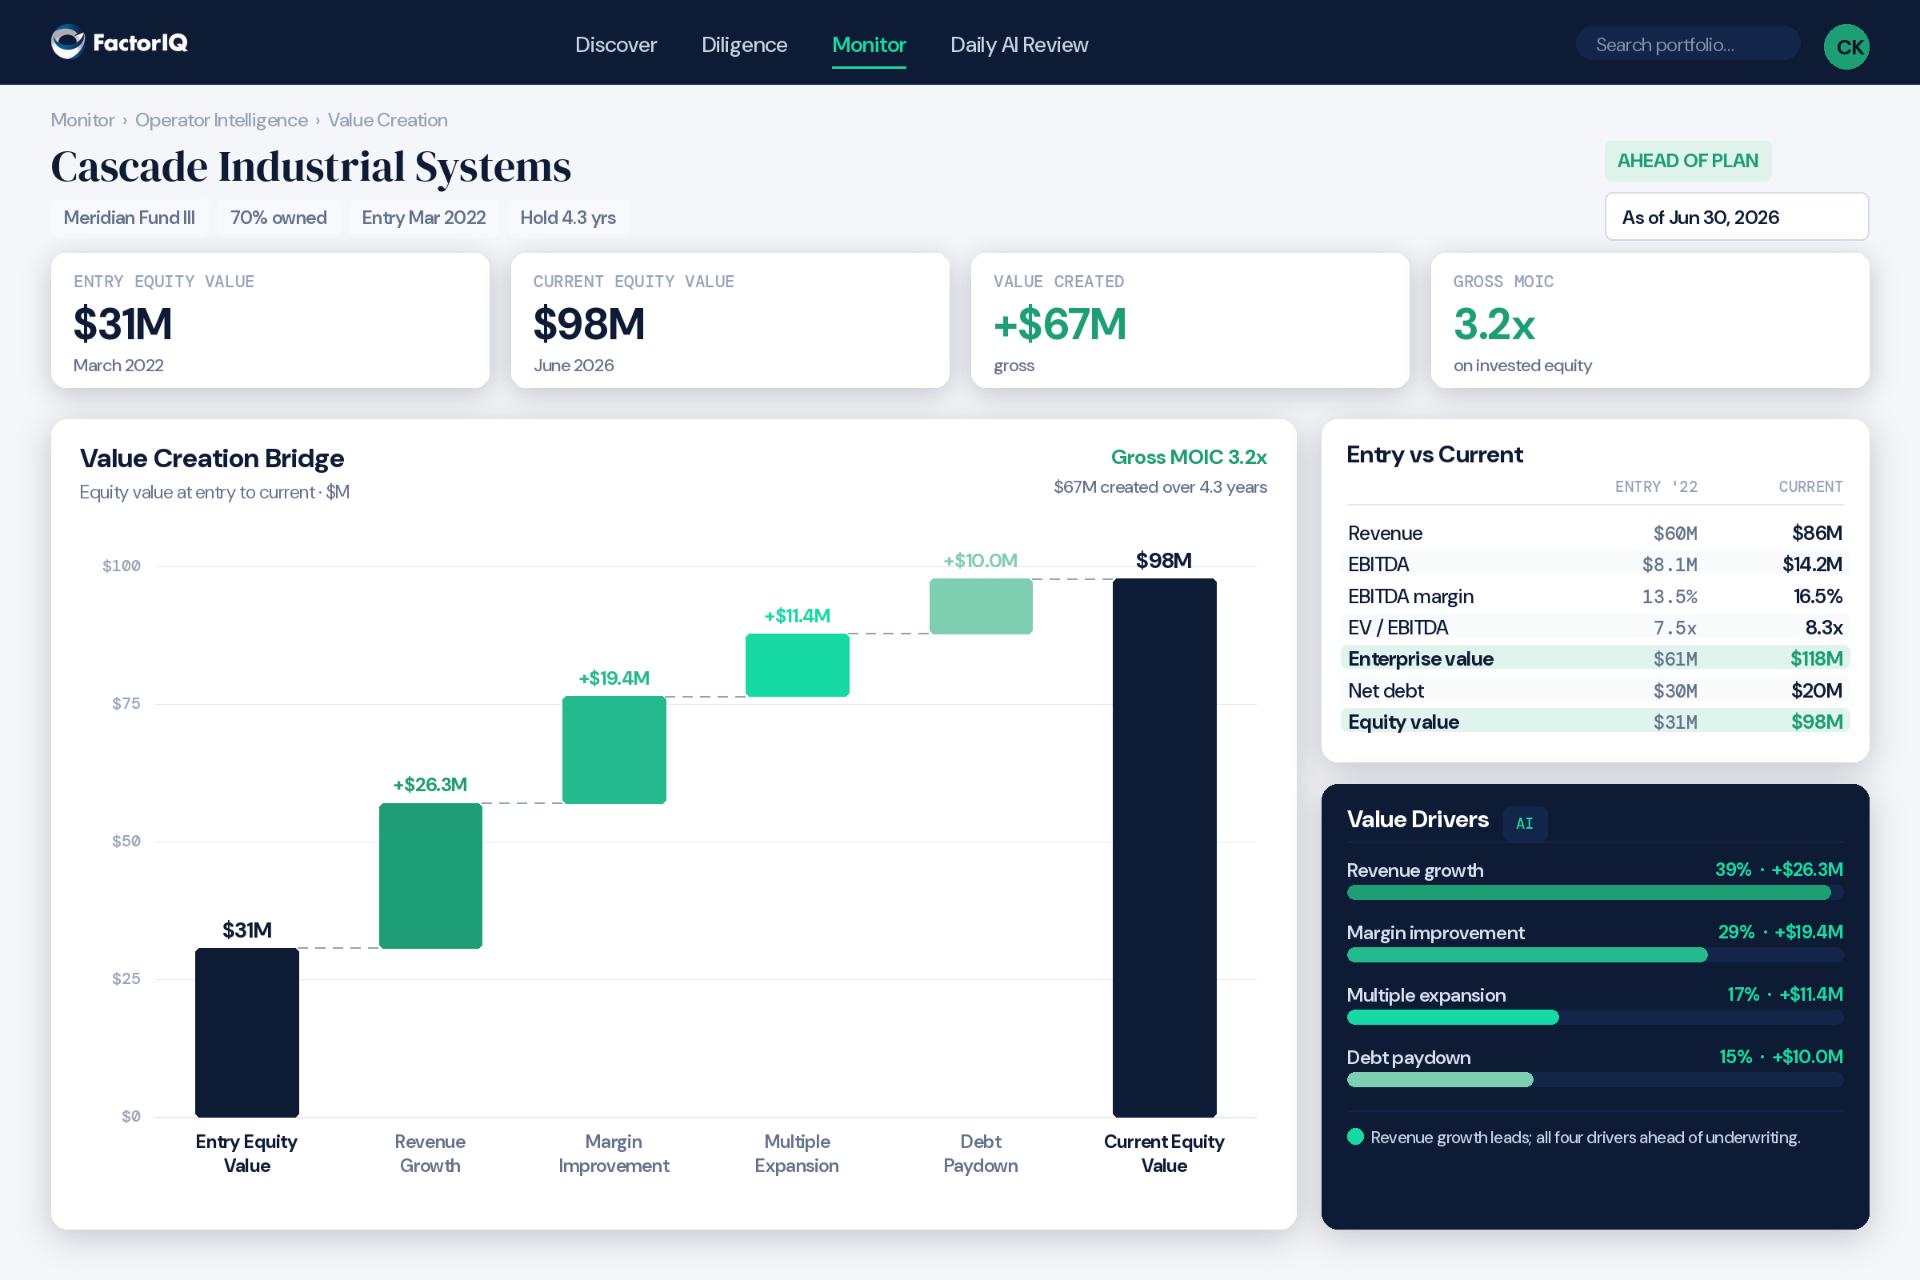
- 1
Value Creation Bridge: entry equity value walked forward through revenue growth, margin improvement, multiple expansion, and debt paydown to current equity value.
- 2
Entry vs Current: revenue, EBITDA, enterprise value, and equity value side-by-side, with the period that changed.
- 3
AI Value Drivers: revenue growth, margin improvement, multiple expansion, and debt paydown ranked by contribution to value created.
What the platform computes
Fund-level performance and company-level operating truth, side by side.
Fund level
| Metric | How it's computed |
|---|---|
| IRR | Gross and net, since inception and by vintage, with attribution by portfolio company. |
| MOIC | Realized and unrealized multiple, rolled up from underlying company marks. |
| DPI | Distributions to paid-in — cash back to LPs against called capital. |
| RVPI | Residual value to paid-in, tied to the latest quarterly valuation marks. |
| TVPI | Total value to paid-in, reconciled to the fund administrator each quarter. |
Metric
IRR
How it's computed
Gross and net, since inception and by vintage, with attribution by portfolio company.
Metric
MOIC
How it's computed
Realized and unrealized multiple, rolled up from underlying company marks.
Metric
DPI
How it's computed
Distributions to paid-in — cash back to LPs against called capital.
Metric
RVPI
How it's computed
Residual value to paid-in, tied to the latest quarterly valuation marks.
Metric
TVPI
How it's computed
Total value to paid-in, reconciled to the fund administrator each quarter.
Portfolio-company level
| Metric | How it's computed |
|---|---|
| Revenue & gross margin | Monthly actuals against plan and underwriting, decomposed by segment, product, and geography. |
| EBITDA & adjustments | Reported and adjusted EBITDA with every add-back itemized — the same bridge you'll show at the next board meeting. |
| Working capital | DSO, DPO, and DIO trended monthly, with cash-conversion-cycle days as a single number. |
| Cash conversion | EBITDA-to-cash walk, capex intensity, and free-cash-flow yield against the underwriting case. |
| Custom operational KPIs | The two or three KPIs the operating partner actually watches — units, utilization, retention, backlog — configured per company. |
| Peer benchmarks | Industry comparables by sector and revenue band, so a margin number reads as strong, average, or weak on the spot. |
Metric
Revenue & gross margin
How it's computed
Monthly actuals against plan and underwriting, decomposed by segment, product, and geography.
Metric
EBITDA & adjustments
How it's computed
Reported and adjusted EBITDA with every add-back itemized — the same bridge you'll show at the next board meeting.
Metric
Working capital
How it's computed
DSO, DPO, and DIO trended monthly, with cash-conversion-cycle days as a single number.
Metric
Cash conversion
How it's computed
EBITDA-to-cash walk, capex intensity, and free-cash-flow yield against the underwriting case.
Metric
Custom operational KPIs
How it's computed
The two or three KPIs the operating partner actually watches — units, utilization, retention, backlog — configured per company.
Metric
Peer benchmarks
How it's computed
Industry comparables by sector and revenue band, so a margin number reads as strong, average, or weak on the spot.
Design partner program
We wanted the EBITDA bridge to be a living document, not a quarterly artifact. That's what we're building with FactorIQ, against our own portfolio, in the open.
Named customers arrive as the program does. Learn about the Design Partner Program →
"iLEVEL tells you what the fund did. FactorIQ tells you what the companies are doing."
What this sits alongside
Works alongside your fund administrator, your CRM, and your data room.
FactorIQ reads from them — it doesn't ask you to leave them. Fund accounting stays with SS&C, Alter Domus, or Citco. Deal flow stays in DealCloud or Affinity. Diligence artifacts stay in Datasite or Intralinks. The portfolio companies' general ledgers — NetSuite, Sage Intacct, Microsoft Dynamics, QuickBooks — stay exactly where they are. FactorIQ turns what those systems already produce into an answer a deal partner, a VP, or a CFO can act on the same day.
See it against your own funds and portfolio companies.
A 30-minute walkthrough using your buyout theses, your portcos, and your covenants — mapped to the EBITDA bridges and 100-day plans you already run.
Request a demo