
Monitor
Analytics Workspace
Ask your portfolio a question in plain English. Get an answer that shows its work.
What it does
The capabilities.
01
Natural-language portfolio queries
Ask questions across every portfolio company, fund, and asset class in plain English. The workspace translates the question into the right data model and returns an answer, not a SQL prompt.
02
Graph Generator
Build custom charts from any metric, entity, and timeframe without touching a spreadsheet. Compare companies, funds, or sectors on the dimensions that matter to the question.
03
Auto-generated performance dashboards
Dashboards assemble themselves around the metrics you actually track — IRR, MOIC, DPI, TVPI, revenue growth, and operating KPIs — so the view is current without a manual rebuild.
04
Entity-scoped data catalog with lineage
Every metric is tied to the source entity, connector, and transformation that produced it. You see where the number came from, when it was updated, and what it depends on.
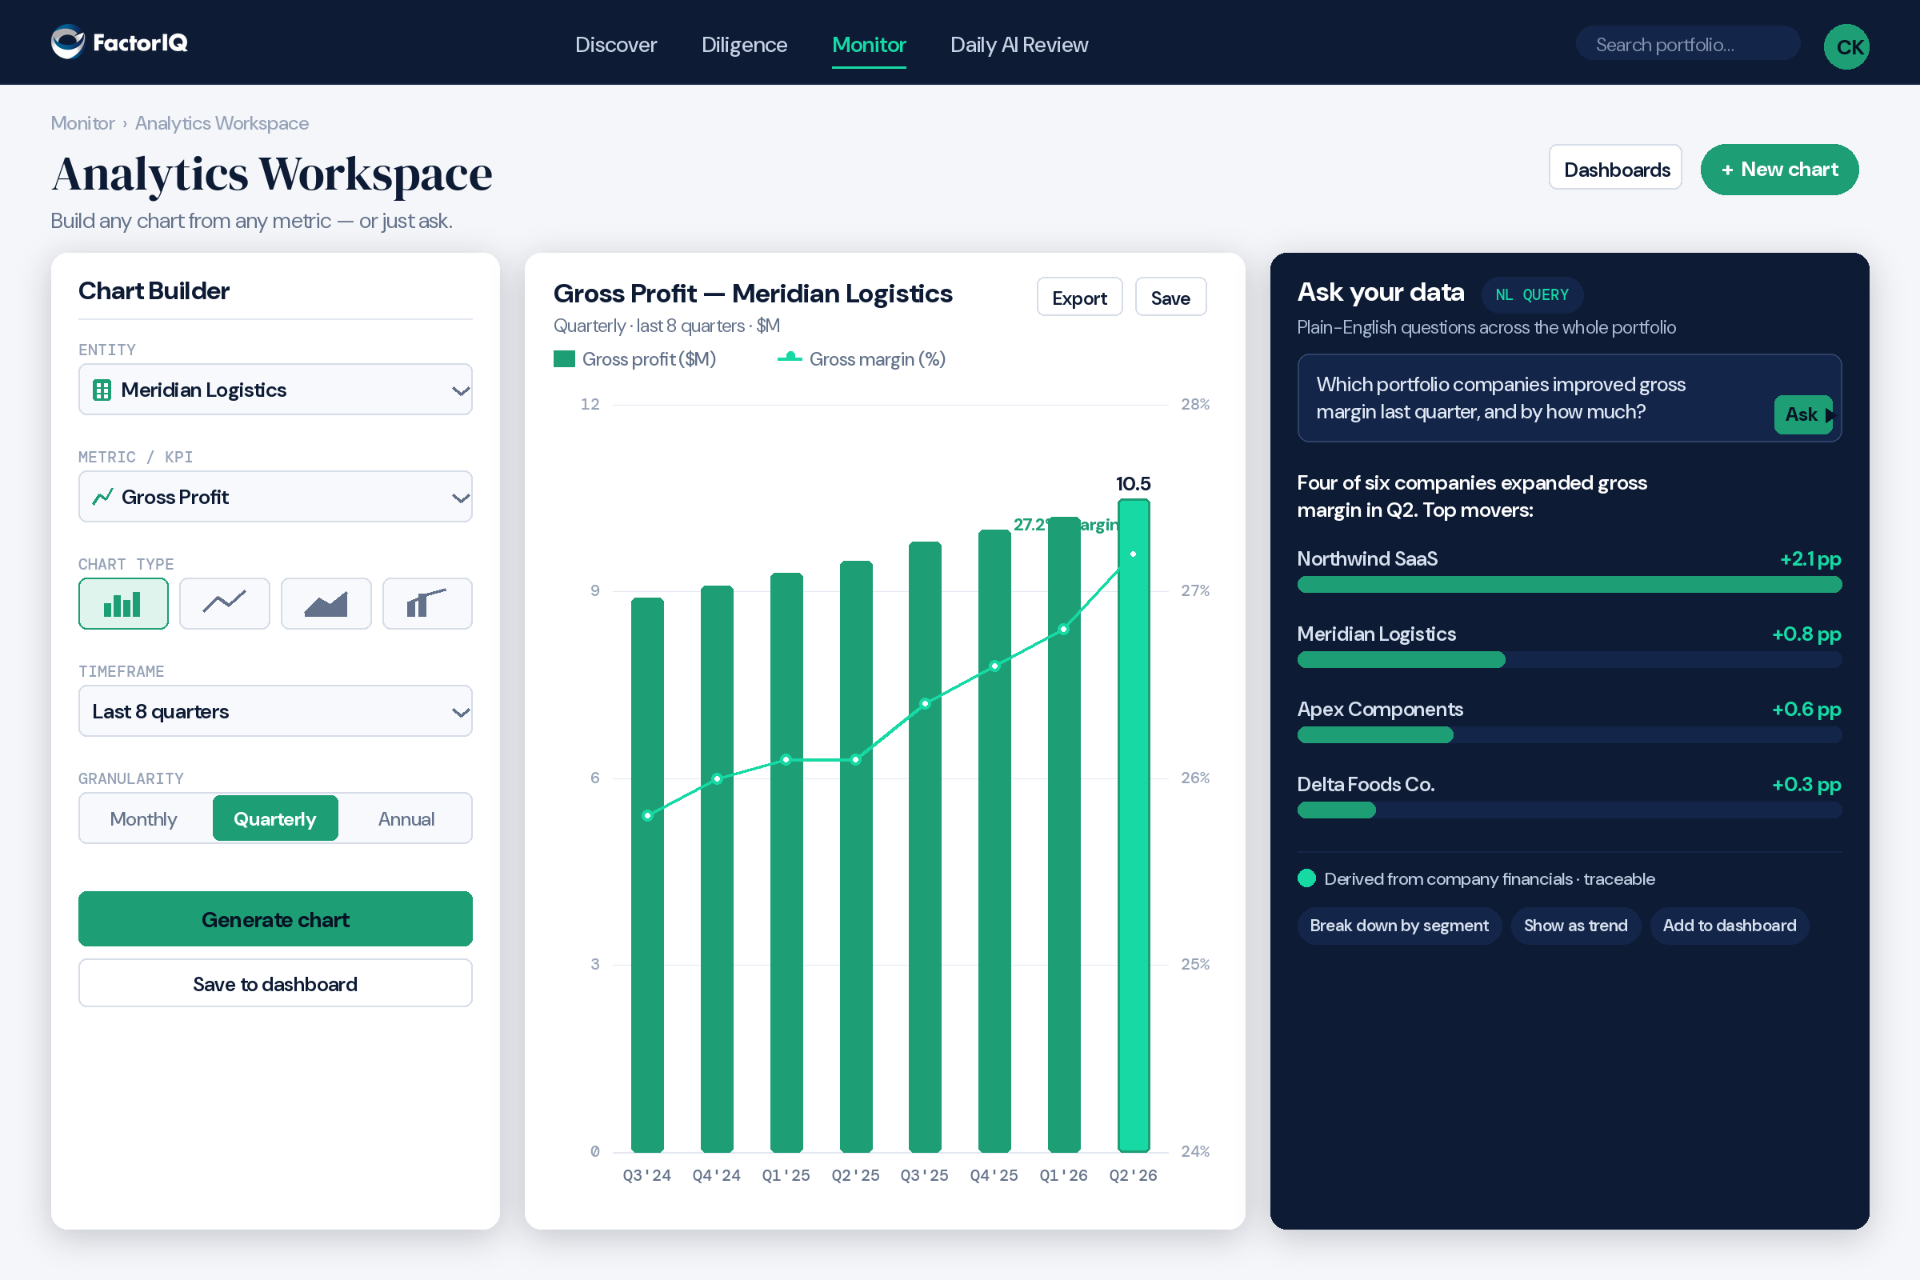
- 1
Natural-language question: 'Which portfolio companies improved gross margin last quarter, and by how much?' — plain English parsed into a portfolio-wide comparison.
- 2
Source lineage: 'Derived from company financials · traceable' — every answer carries the connector and update path so it can be audited, not trusted blindly.
Who uses it
Built for the people who act on it.
Investment teams
Answer ad-hoc questions in minutes instead of waiting for a quarterly report.
CFOs / Finance teams
Reconcile numbers across systems with lineage visible for every metric.
IR / LP-facing teams
Generate LP-ready charts and dashboards with the source attached.
Every answer includes the source. No black boxes.
See it against your own portfolio.
A 30-minute walkthrough using your asset classes and your metrics.
Request a demo